Flasks Lab
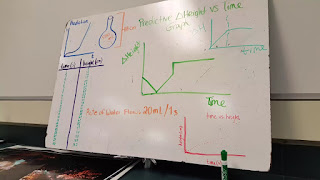
As our first lab of the year, the mission was to find the relationship of the height of water being added to a flask over time (height v. time). Since we cannot control the rate of water coming out of faucet, we just added 20mL of water to the flask to represent every second to make sure that the rate would not be an issue (however, errors do occur later on).


WHAT WE LEARNED AND WHAT HAPPENED
*if the flask is 500mL, we expect to pour 20mL of water 25 times. By the 25th pour, if the flask is not completely filled or it is overfilled, that can be an indication that there was errors when adding the water.
*It is difficult measuring 20mL of water each time because during those 25 times, each pour could have been off from the 20mL = opportunity for error.
*Measuring the height was a challenge itself. Since the flask is not straight but is curved, measuring the vertical height of the water with a ruler is difficult. Some ways to measure could have been sticking the ruler in the flask to find the direct height (displacement of the water from the ruler would not be an issue because the displacement is constant in each measurement with the ruler), putting the ruler behind the flask to look directly through it to see the height (since the flask is transparent), or just placing the ruler vertically to the side of the flask and as close as possible to take the measurement side by side. However, none of these are exactly accurate so each measurement could have also been an opportunity for error.
*when graphing the data (the change in height v. time), we expect to see areas of the flask that were wider to have less steep lines on the graph (because those areas take more water to rise in height compared to less wider areas of the flask). Therefore, we expect to see thinner areas of the flask to have steeper lines on the graph. When the water reached the neck of the flask where it is straight and not curved, the line on the graph is positively linear (because water is now increasing in height at a constant speed). When water is being added to curved areas of the flask, the lines on the graph look exponential. As the flask curves in and gets thinner and thinner, the exponential-looking graph's slope becomes steeper and steeper too. Likewise, as the flask curves out and gets wider and wider, the exponential-looking graph's slope becomes less and less steep.
*parts the the graph LOOK exponential, but whether or not they really are is unknown.
*when we convert the graph to the CHANGE IN HEIGHT v. TIME, the shape of the graph looks like the shape of the side of the corresponding flask. (this would be true if you cut the flask in half and both pieces looks like the reflections of each other).
*in the future, try doing this experiment with other containers too that do not necessarily look symmetrical if cut in half
*this can be a possible topic to delve into later when doing the IA


Great first post!
ReplyDelete